
Top 5 Innovative 2024 Power BI Visuals Examples
Power BI Visuals are graphical representations of data that aid in better understanding, interpretation, and analysis. These visual elements are powerful tools that bring data to life, enabling users to discern patterns, trends, and correlations effectively. For reference, all the Power BI visuals used in this article were built using the Power Template features, allowing […]
Continue Reading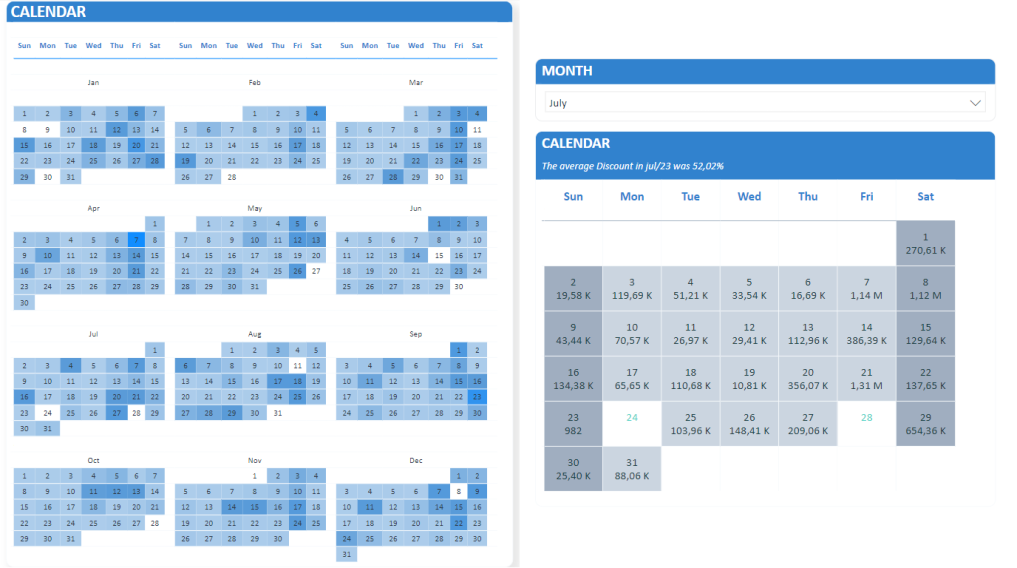
Calendar in Power BI using Matrix + Heat Map + Free Download
One way people often find patterns or trends in data is by using a line chart. In this post, I’ll introduce Calendar in Power BI using Matrix, a different way to see seasonality or trends in your data over time. Perhaps one of the most potent advantages of this method is to use a Matrix […]
Continue Reading